Why Care about Nitrogen?
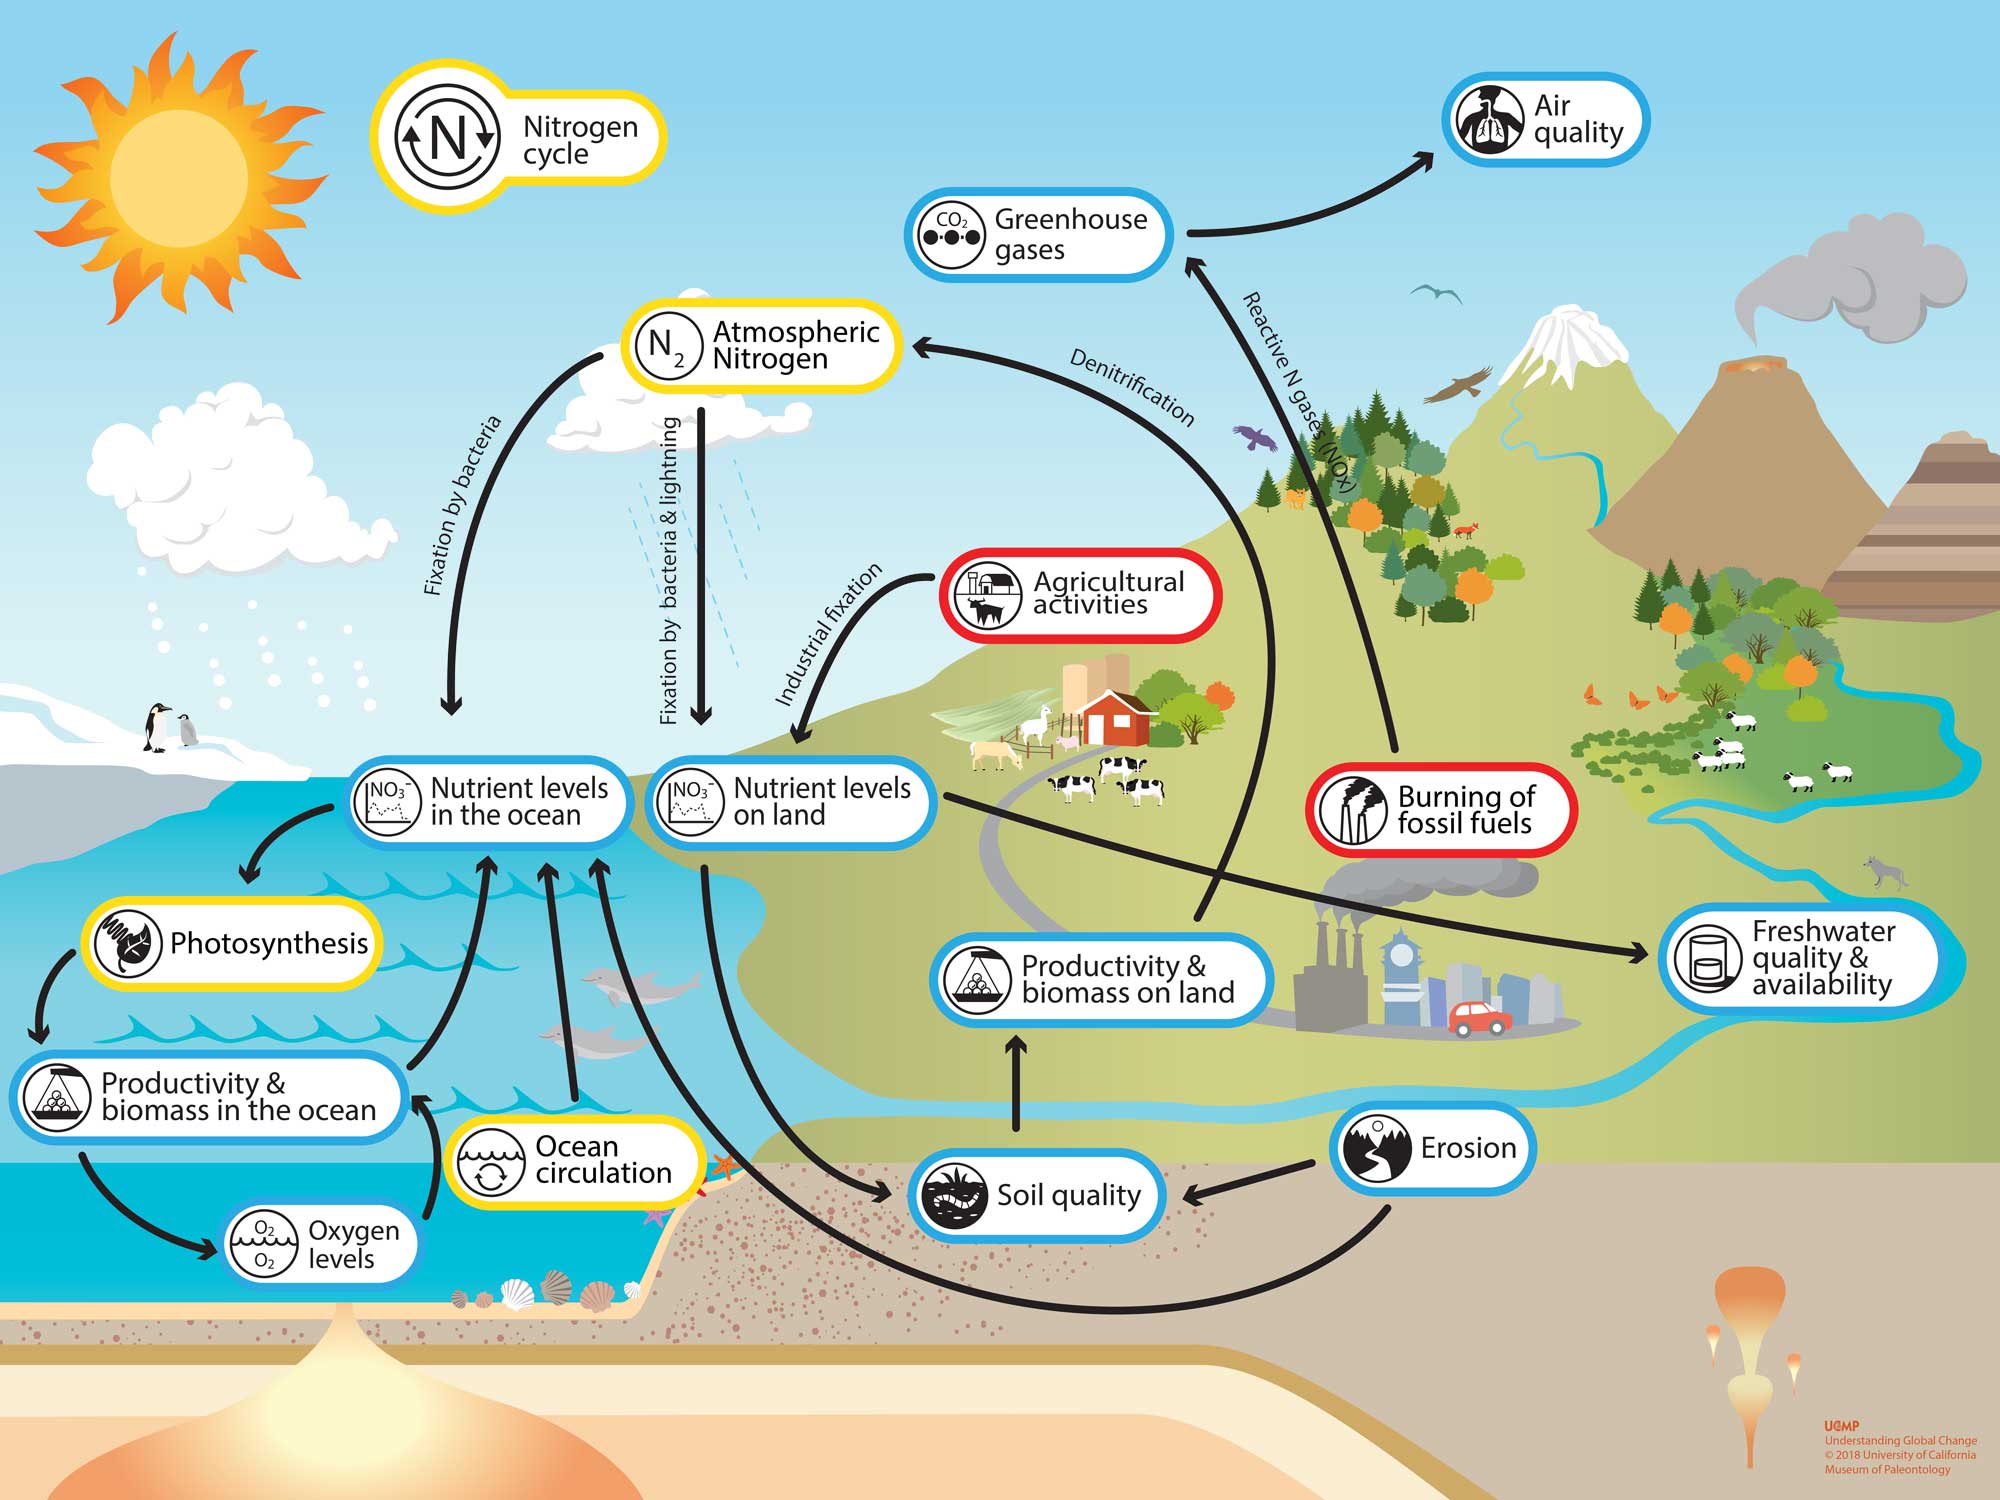
Nitrogen is one of the fundamental building blocks for life on Earth especially plants. Plants need nitrogen to grow and often nitrogen is the limiting factor in how productive plant growth can be. This is why nitrogen is a primary ingredient in fertilizers. Unfortunately, not all the nutrients in fertilizers get absorbed by plants and the excess moves its way into rivers, lakes, oceans and groundwater as agricultural runoff. This sets the nitrogen cycle out of balance which has environmental impacts like the hypoxic zone in the Gulf of Mexico (Figure 2).
In short, this hypoxic zone is an area where human derived nutrients like nitrate, are carried down the watershed and deposited in the Gulf of Mexico. The excess nutrients cause algae and other organisms to grow in excess. The resulting organic matter sinks to the bottom of the ocean and decomposes, consuming available oxygen. This creates hypoxic conditions which can force fish out of the area and cause death to organisms that can’t move out of the area. (This cycle is shown in Figure 1). This year (2021) it is larger than average. For more on the hypoxic zone visit here.

Data can help
One way to help remedy the environmental problems like the hypoxic zone, is use data that helps guide land management decisions. Our government has amassed a huge collection of satellite imagery, surveys and water chemistry data that is readily available to analyze. I decided to analyze a few of these datasets to get an idea of how land surface characteristics, particularly the plants, are related to nitrate levels in streams. Here are the data types I used:
- NDVI (Normalized Difference Vegetation Index) – measures greenness of plants
- MODIS ET (Evapotranspiration) – measures the amount of water transferred from the land to the atmosphere
- PRISM Temperature
- PRISM Precipitation
- Crop land data layer – a survey that shows where and what types of crops are grown
- Land use land cover – a survey that shows where and what land uses are
- Digital Elevation Model (DEM) – I used a 30m DEM from the National Map
- In-situ nitrate-nitrite and discharge – this data comes from a sensor inside of a stream that continuously collects data
Analyzing all this data provides insight into what conditions must be met to see drops or increases in nitrate levels. In a way, I’m fishing this data for connections between nitrate levels in streams and land surface characteristics. I live and work in South Dakota so I chose a study area in Eastern South Dakota along the Big Sioux River where nitrate data is available to test out some methods on how I can relate all this data together.
Figure 3: Study area showing the locations of nitrate data. I used site USGS 06481000 for this study because it contains the nitrate data for the Big Sioux River. The other sites are groundwater wells I plan to add into the analysis later.
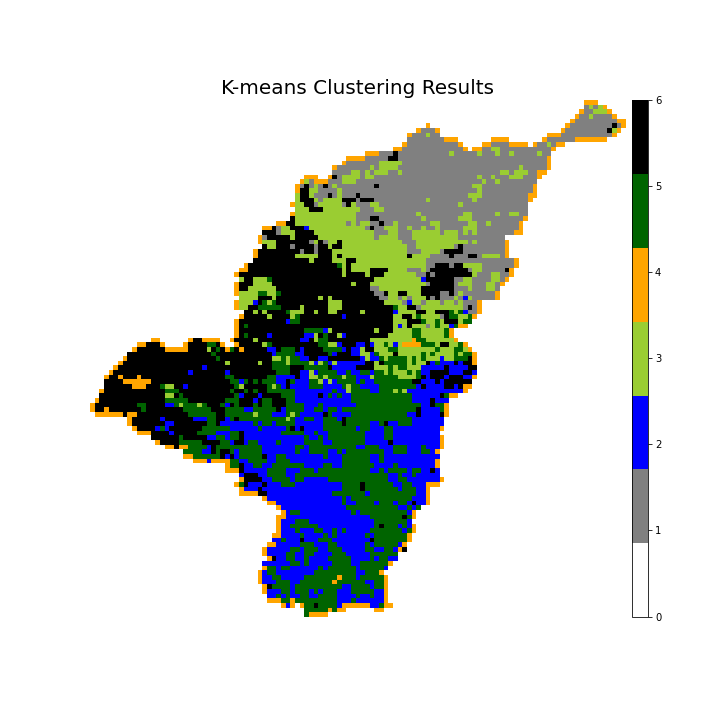
K-means Clustering
Originally, I was trying to find relationships with land cover and nitrates across the entire project area. I soon realized that I wasn’t going to see any relationships because the area that is responsible for effecting the nitrate levels at the sensor is probably much smaller. So, I defined areas with similar characteristics or homogeneous areas with a k-means clustering analysis. In short, k-means clustering is an exploratory tool that looks for similarities across all the data and lumps them into clusters. You can see a green cluster in Figure 4 at the bottom of the study area. This is region that is most likely contributing to nitrate fluctuations near USGS the sensor.
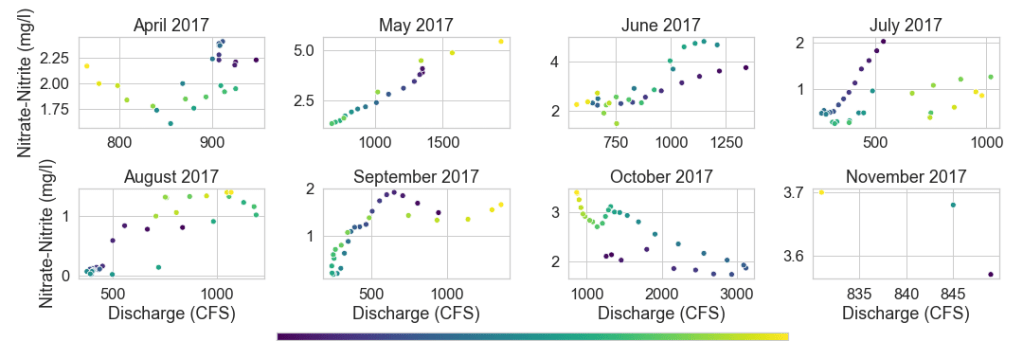
Hysteresis Loops
The nitrate and discharge data are time series data collected at a single point so, I needed to analyze them separately. I used hysteresis loops to look for patterns in the data that reveal pathways nitrates are taking into the stream. Hysteresis loops in hydrology are discharge plotted against concentrations of pollutants and color coded by time. If there are clear loops in the data, you can use the direction of loop indicated by time to figure out if nitrates are coming from the surface or subsurface.
Figure 5 shows the nitrate-discharge data for the year 2017. In October, there is a loop moving in a counterclockwise direction which suggests nitrates are coming from subsurface source or somewhere further upstream.
Next Steps
The next step of this analysis is to regress the nitrate data that form loops against the values of the remote sensing data found in my cluster around the nitrate sensor. If strong correlations exist, this type of analysis could be used to create new state regulated management units and provides a foundation for further scientific investigations.
You can follow the progress of this project on my GitHub.
References
NOAA. Larger-than-average Gulf of Mexico ‘dead zone’ measured | National Oceanic and Atmospheric Administration. (2021). Retrieved 28 December 2021, from https://www.noaa.gov/news-release/larger-than-average-gulf-of-mexico-dead-zone-measured.
USCMP. “Nitrogen.” Understanding Global Change, 10 Sept. 2020, ugc.berkeley.edu/background-content/nitrogen/.
